Use Your Data to Evaluate when it’s Time to Try Something New
Do you have a data-driven approach for looking at what’s working and what isn’t working?
With an organized database, Airtable’s custom views and visually appealing dashboards will set you up to turn your statistics into revenue.
Metrics are relative depending on what you are trying to accomplish. When you figure out what your most important metric for growth is, focus on that.
Here are some of Airtable’s tools that have helped my clients “own” their data by putting key metrics to use for making smarter decisions:
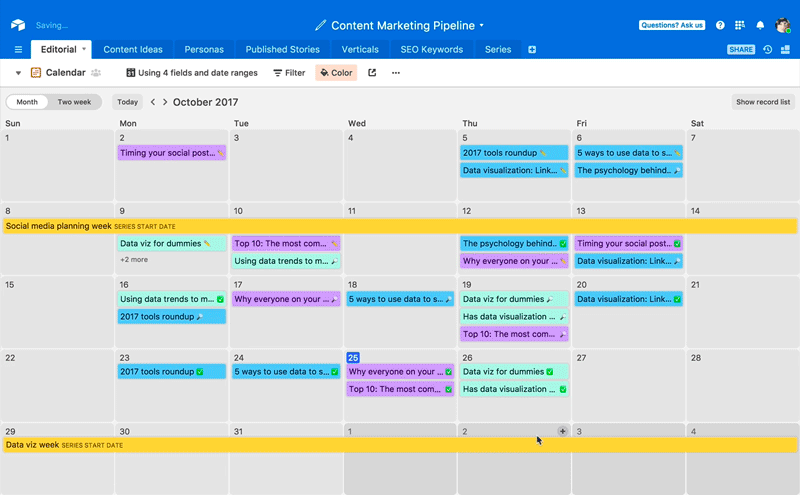
Calendar views are designed so that teams with calendar-intensive workflows can get extra insights from their records
The Gantt block let’s you see at a glance what needs to be done, when, and in what order

The Gallery view represents your records as large cards

Formulas allow you to compute values based on values in other fields
With custom “views” you can filter, sort, hide and group data; a “view” is just a different way of looking at the same underlying data
Dashboards bring your workflow to life

Automatically generated Forms let you collect information from anyone and save it to your database
The take-away: